Economic models used, and predictions derived from them, tend to have a narrow and shallow understanding. There are thousands of economists at work predicting current and future outcomes. Unfortunately, however complex the models are, the capability of providing accurate outcomes is in question. Currently the economy is in a recessionary state, and applying this narrow and shallow approach will always be behind the real world outcomes. As the saying goes, “they are playing inside the sandbox, and oblivious to their surroundings.”
Decisions made always have a future outcome, not always knowable in advance. However, failing to attempt or predict and monitor outcomes for revision, will usually produce an undesirable outcome. In the case of trade deficits, they are reported and knowable. The 17+ Trillion trade deficit is funding provided to other trading partners in pursuit of their growth objectives at the the expense of U.S. futures.
Prior to 1998, trade deficits were manageable. Over the period from 1998 and 2022, imports have resulted in increasing loss of real income and degradation of the U.S. infrastructure. Today, the suggested method of improving the infrastructure is to borrow. Prior the this time taxes and fees from production paid for these items.
Additionally, the trade deficit can be used by trading partners to build their infrastructure, military, shipping, and buy other assets. China has routinely purchased raw materials resources previously used by the U.S. when manufacturing was performed in the U.S. China has also made agreements with countries such as Italy and Spain to secure shipping ports.
The data below indicate much of the 30+Trillion in deficit is, in fact, an outcome of taking a global perspective, where China and other countries have not reciprocated. A case could be made the U.S. is funding Chinese and Russian aggression.
Recession seems to be a long-term prediction. With the possibility of international conflict, shortages will more likely occur than not. Plan for depression.

The World Trade Organization (WTO), established in 1995, has the objective of facilitating international trade.
Several articles and research papers have been written on open free trade. Review the CATO INSTITUTE for background issues that impact global trade.
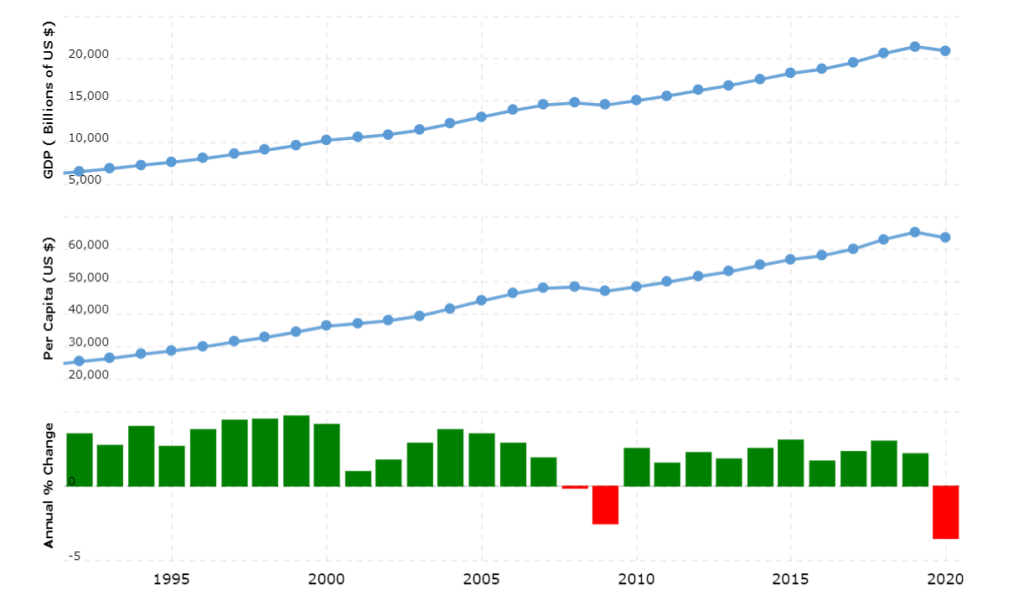
U.S. GDP Growth Rate data for 1992 – 2020

Summary:
Horizon scanning is the observation of issues from a high level and is frequently referred to as viewing activity from 40,000 feet (eight miles up). The point being, that occasionally organizations and society become so engrossed in the detail, that they miss the overall picture and can’t see the forest for the trees.
Data identified in the figure and table for Imports vs Exports & Trade Deficit indicate the total trade deficit for the period 1992-2021* is 17 trillion, 132 billion, 255 million. That is 815,820,238,095 on an annual basis.
Information in this posting will be addressed in the SOTU: BACKDROP SUMMARY for 2021-2028.
End of Posting